Latest Structure Condition Report
Click the
Latest Structure Condition Report tab to view a grid showing the latest condition for each of your structures.
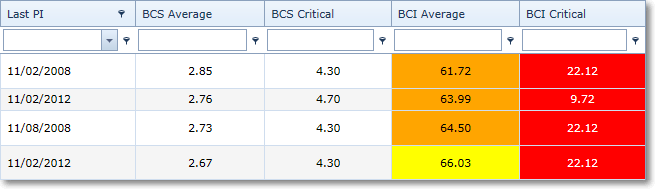
The grid includes a few basic details regarding your structure (name, identifier, type), then includes the dates for the last completed general and principle inspections along with the latest condition information (Bridge Condition Scores and Indices).
The BCI values are colour-coded according the rating ranges from the guidance.
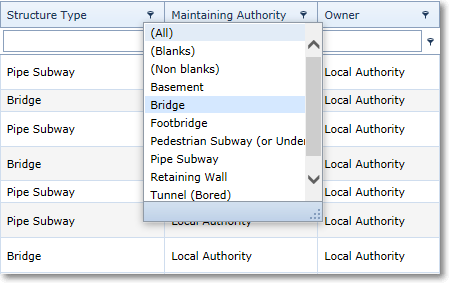
If you would like to filter the results in the grid you can do so for each column by completing either a filter value or by using the drop down provided. In the example below the results are being filtered to a particular structure type.
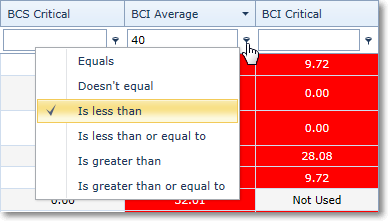
When providing a filter value remember to first check the operator being used by clicking the
filter symbol to the right of the
input box. So in the example below the
Is less than operator has been selected. The results grid will display all structure with a BCI Average less than 40.
If you need to export the results grid as an excel file click the
Export to Excel button just above the results grid header. You can also open up the latest inspection for a structure by clicking on the Name of the structure. This will navigate the user to the correct inspection proforma.
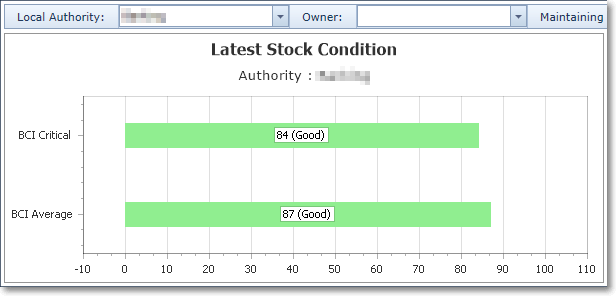
The
Latest Stock Condition appears as a Chart, just above the Latest Condition Grid and displays a bar chart of your current BCI Average and Critical.
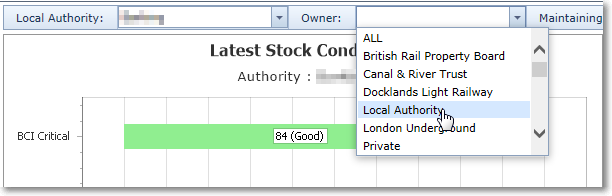
Filtering options are also available. Above the chart there is a toolbar with a number of drop downs you can use to filter your results. In the example below the chart data is being filtered to include only structures owned by the Local Authority in the stock calculation.
The chart can also be exported from the toolbar above the chart itself. Select the export format using the drop down, the click either the
Save or the
Save in new window buttons.
 Latest Stock Condition By Structure Type
Click the
Latest Stock Condition By Structure Type tab to see stock condition information for your authority split between the different structure types.
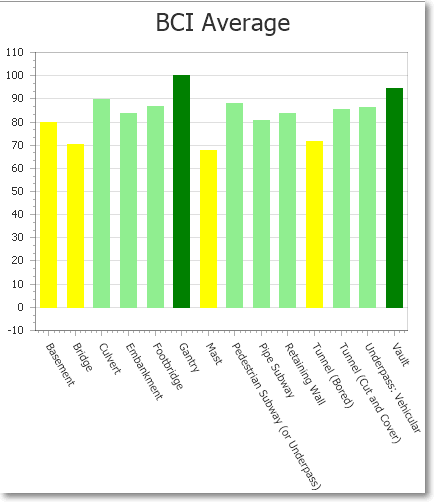
This tab displays a bar chart of your current BCI Average and Critical for each structure type.
Filtering and export options match those of the
Latest Stock Condition tab.
Annual Condition Trend
Click the
Annual Condition Trend tab to view a bar chart showing annual counts of structures within each of the bridge condition rating bands.
The chart is a stacked bar chart . The chart uses counts of structures according to their BCI Average rating. A bar is generated for each year that BCI information is present for your stock. Hover over each stack to get the count of structures within that particular stack.